

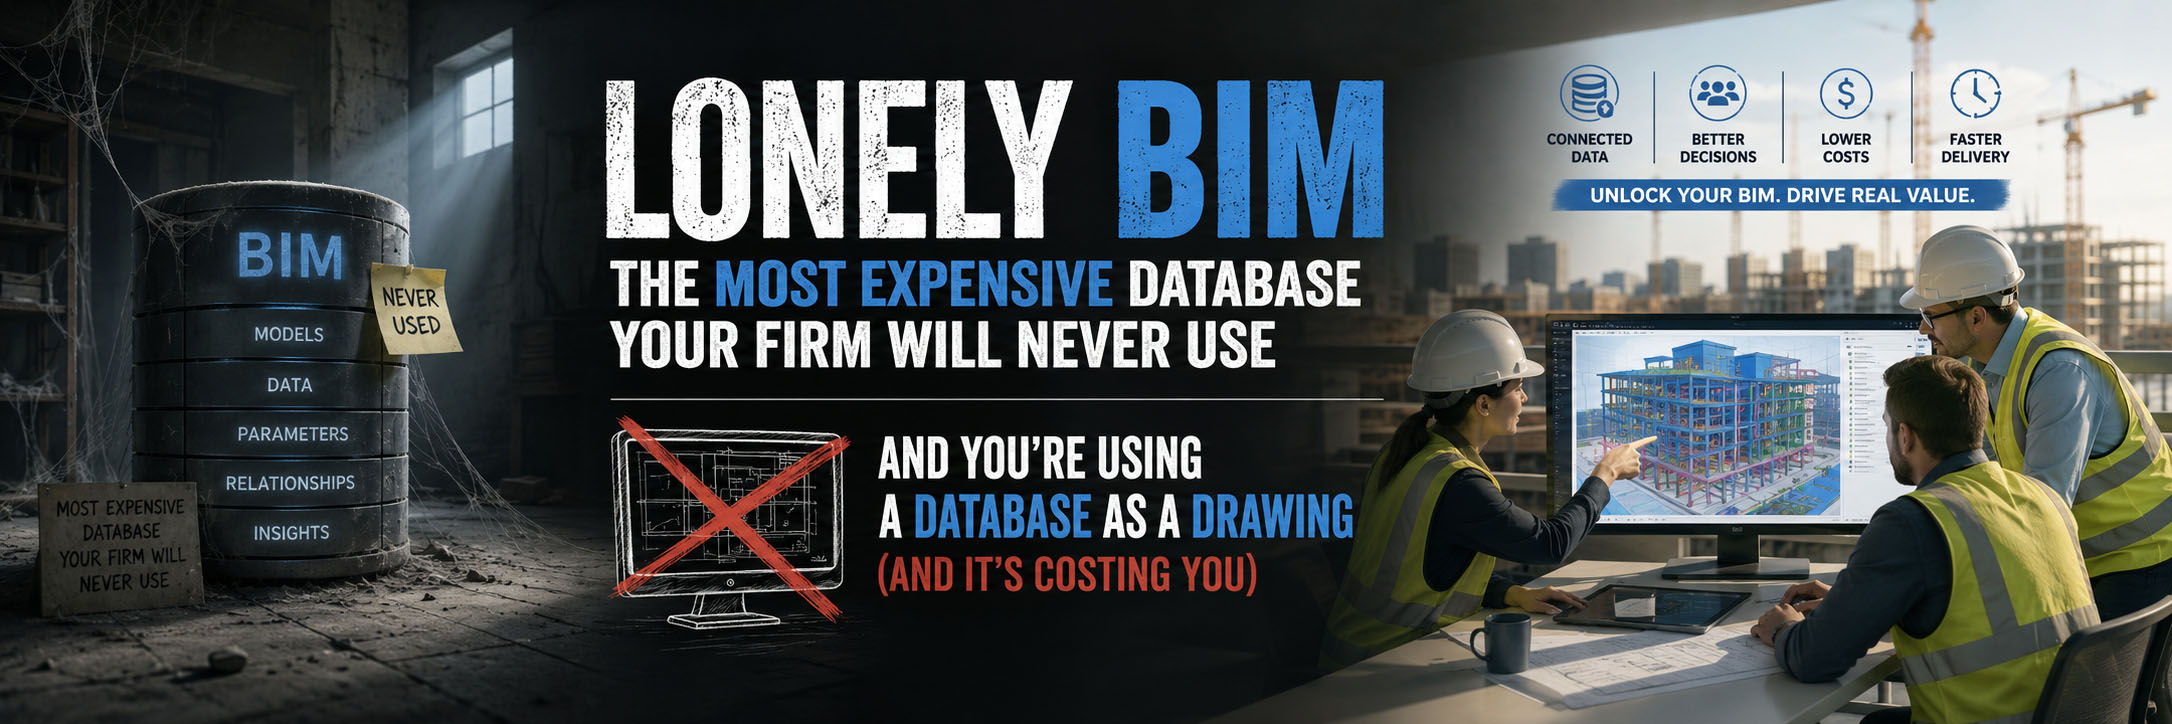
Why the model you paid a fortune to build is dying on a server right now
There’s a term floating around the BIM world that I run across constantly.
Lonely BIM.
I first heard it described in a training course, and the second I heard it, I laughed out loud. Because it’s perfect. Lonely BIM is industry shorthand for data that gets created for exactly one use, by exactly one person, and then never gets used again.
Think about what that actually means on one of your jobs.
Your VDC team spends weeks building a Revit model. Every wall, every door, every window, every room, every finish, every square foot, every piece of equipment. It’s all in there. Room numbers. Areas. Levels. Departments. The model knows more about your building than any single human on the project does.
And then the coordination meeting ends, the GMP gets set, and that model goes to sleep on a server. The estimator never opens it. The owner never sees inside it. The PM re-keys half the room schedule into a spreadsheet because that’s faster than learning Revit. The superintendent gets a flat PDF.
You paid for a database. You’re using it as a very expensive drawing.
That’s Lonely BIM. And it’s costing you real money.
The Number That Should Make You Wince
I went looking for data on this, because “it’s costing you money” is easy to say and harder to prove. The number I found is worse than I expected.
In a landmark study, Autodesk and the consulting firm FMI estimated that bad data may have cost the global construction industry $1.85 trillion in 2020. Bad data being data that’s incomplete, inaccurate, inconsistent, or untimely. And here’s the part that stings: thirty percent of respondents said that more than half of their project data is “bad” and results in poor decision making more than 50 percent of the time.
Let that sink in. A third of the industry believes most of their own data is garbage.
It gets more personal when you scale it down. According to the same body of FMI research, construction professionals spend more than 14 hours per week on non-optimal tasks like searching for files, resolving formatting issues, or reconciling outdated documents. That’s more than a third of the workweek. Per person. Gone. Hunting for information that already exists somewhere, in some file, that nobody can find or trust.
Now connect those two facts. You have a Revit model that contains the single most accurate, structured set of building data your firm will ever produce. And you have a team spending a third of their week hunting for building data in spreadsheets and email threads.
The information they need is already in the model. It’s just lonely.
Two People Who Feel This Pain (and Don’t Know They Share It)
Here’s the part that makes Lonely BIM such a quietly expensive problem. Two completely different people on your team are frustrated by it, and neither one realizes they’re frustrated about the same thing.
Leadership is frustrated because they can’t get a straight answer fast. How much rentable square footage is on floor three? How many of those doors are the expensive hardware spec? What’s the area breakdown by department for the budget conversation? They ask, and the answer comes back two days later as a screenshot of a spreadsheet that somebody typed by hand from the model. They’re paying for a sophisticated digital twin of their building and getting served information at the speed of carrier pigeon.
The VDC or BIM manager is frustrated for the opposite reason. They built the thing. They know every answer is right there in the model, beautifully structured, perfectly accurate. And they watch it get ignored while people re-create that same data badly in Excel. There are few things more demoralizing than doing excellent work that nobody uses.
Same problem. Opposite ends. The data is rich, accurate, and trapped.
The fix isn’t “everyone learns Revit.” Owners are never going to open a Revit model, and they shouldn’t have to. The fix is getting the data out of the model and in front of the people who need it, in a form they can actually read.
Where Power BI Walks In
This is where a tool like Microsoft Power BI earns its spot in the conversation. And before your eyes glaze over at “business intelligence software,” stay with me, because the idea is simpler than the name.
Power BI does one thing extremely well: it takes data from a bunch of different places that don’t normally talk to each other and turns it into a single live dashboard that anyone can read. Pull the room and area data from your model. Pull cost data from your estimate. Pull schedule data from wherever it lives. Power BI stitches them together into one interactive picture.
Here’s the part that matters for the owner. Even non-technical team members can keep these dashboards up-to-date with minimal effort. The owner clicks on floor three, and every chart on the screen instantly shows just floor three. Click a department, the whole view filters to that department. No Revit. No spreadsheet archaeology. Just answers.
And here’s the part that matters for the VDC manager. The connection is live. This isn’t a one-time export that’s stale the moment the design changes. Modern connectors pull the latest model data on a schedule, so when the design updates, the dashboard updates. Your work stays current without you re-doing it every week.
I want to be careful here, because I’m an IT guy, not a software salesman. Power BI is not magic. It will happily display garbage if you feed it garbage. Which brings us right back to the point.
The Catch Nobody Mentions in the Demo
Every Power BI demo makes this look effortless. Click, drag, beautiful dashboard, applause.
What the demo doesn’t show you is the part that actually determines whether this works: your data has to be clean and structured before any of this is worth doing.
If your room names are “MECH” in the model and “Mechanical” in the spreadsheet, the tool can’t match them. If five project managers use five different naming conventions for the same thing, you get five different answers. If your model is missing the parameters you actually care about, no dashboard will conjure them out of thin air.
We watched this exact lesson get taught from two different stages at the Advancing Preconstruction conference earlier this month. The data is the lever, not the tool. You can have the most beautiful dashboard software on earth, and it will do nothing for you if the underlying information is a mess.
So the honest order of operations for Lonely BIM is the reverse of what most people assume. It’s not “buy Power BI, then figure out the data.” It’s:
- First, decide what handful of questions you actually want the model to answer. Square footage by floor? Door counts by type? Area by tenant? Pick a few that matter. Don’t try to visualize everything.
- Second, make sure the model and your other sources name those things consistently, so they can be matched.
- Third, connect it and build the dashboard. By the time you get here, this is the easy part.
Do it in that order and Lonely BIM turns into a living, shared single source of truth. Do it backwards and you’ve just built a very pretty way to display bad numbers.
You Don’t Have to Build This From Scratch
Good news for anyone whose stomach just tightened at the phrase “connect it and build the dashboard.” The big platforms have already done most of the heavy lifting.
Autodesk, for instance, offers a Data Connector for Power BI built right into Autodesk Construction Cloud. The workflow is about what you’d hope: schedule a data extraction from the cloud, then click Refresh in Power BI to see the latest. You can combine model properties from Revit, Civil3D, and AutoCAD into a single dashboard, which means a model health view that a non-Revit owner can actually understand.
And this isn’t theoretical. Real GCs are running it today. Autodesk’s own case material features VDC leaders at firms like Barton Malow and Walsh Construction using the Power BI connector to pull jobsite and project data into shared dashboards, with one common thread: shared data on a unified platform drives better decisions around resource planning and execution. There are also third-party connector apps and a public API if your stack is more custom. The point is, you are not the first firm to try to wake up a lonely model, and you don’t have to invent the plumbing.
What This Looks Like on Monday
You don’t need a six-figure software initiative to start. You need to ask one question and refuse to accept “it’s in the model” as an answer.
Pick the report your team re-creates by hand most often. The one somebody rebuilds in Excel every single project because pulling it out of the model is “too hard.” That report is your Lonely BIM canary. It’s proof that valuable data exists and isn’t reaching the people who need it.
Then ask three things. Where does that data actually live? Is it named consistently across our sources? And what would it take to pull it out once and have it stay current? That conversation, more than any software purchase, is what turns a lonely model into an asset.
Because here’s the truth underneath all of it. The construction firms pulling ahead right now aren’t the ones with the fanciest models. The firms with strategies in place to collect, manage, and analyze usable data report fewer project delays, less rework, and fewer change orders. They’re the ones who decided their data was an asset worth using instead of a byproduct worth ignoring.
One More Thing
If you read this and thought “okay, this is exactly the kind of thing my team needs to actually sit down and work through,” I’ve got good news on timing.
The whole question of getting your data out of its silos and into a form that drives decisions is the foundation everything else is built on, including AI. You cannot point AI at a lonely model and expect miracles. You have to free the data first.
That’s exactly the groundwork we’re covering in Session 2 of our AI in Construction series with Rowan Steel-Hall of Smartbuild, coming up June 11 through the Arizona Builders Alliance. It’s a hands-on workshop, not a sales pitch. We’ll be working through how to get your construction data ready to actually do something, which is the unglamorous, deeply valuable step that makes both BI dashboards and AI worth the investment.
If you want to stop your data from being lonely, come spend a morning with a room full of Arizona builders working on exactly that.
Your model already knows the answers. It’s time you started listening to it.
AI In Construction Part 2 – The Live Build Workshop
For over 20 years, Computer Dimensions has been the trusted IT partner for Arizona's architecture, engineering, and construction industry. We help AEC firms communicate better, collaborate smarter, and actually use the technology they've invested in. Because in construction, the tools only work if your team does.
IT Built For Builders.
